The Few Levers that Drive Business Growth
There are only a handful of growth levers in a business
When I first wrote about finding leverage points in a business (aka levers) I thought that they were unique to each business, obscure and required effort and random data dives to uncover. I gave some examples in that post, but I thought I couldn't go further.
That was until I met and talked with Christian Sassano.
I started talking to him because he mentioned he only used a 4-table data model; which when he showed me, I immediately felt too embarrassed to share. How the hell do you expect me to convince data analysts (who are being asked hundreds of questions per day) that they only need 4 tables? I'd be laughed out of the room!
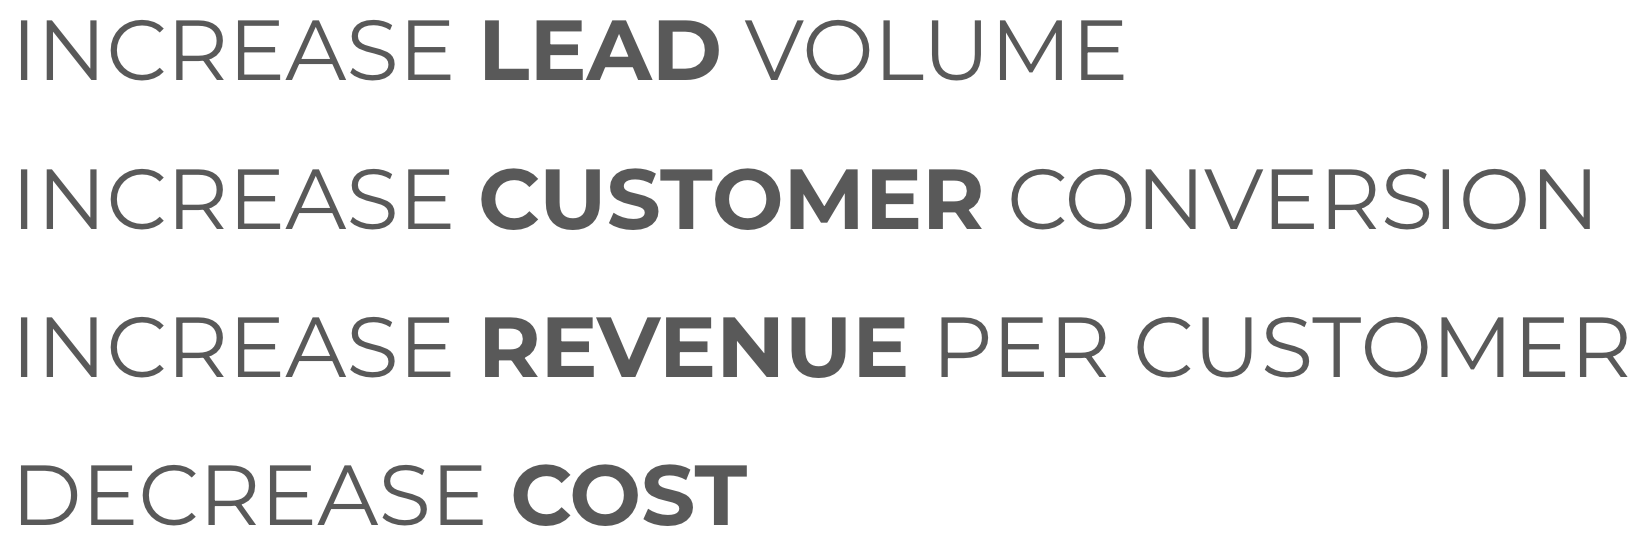
Then he shared a slide deck with me, and one of the slides said there are only four ways to grow a business and improve profit:
-
Get more leads
-
Increase the conversion rate from lead to customer
-
Increase revenue per customer
-
Reduce costs
Wait what?? I was shocked!
How can there be only four? I thought there was an infinite amount of levers and they were unknown until you discovered them. Later found very similar levers in the writings of Jay Abraham one of the most well-respected business and marketing experts of the last 4 decades.
I was convinced. The more I thought about in the next few days, the more sense it made. A lot of the work inside a business is ultimately geared towards those levers and the implications for analytics are actually huge. This way of thinking was also almost identical to how Theory of Constraints tackles business improvement, so naturally I had to combine them all.
A simple model for growth
Once I understood his mental model, how he thinks about improving a business, and how quickly he can get up to speed on a new client I realized that the four tables are really just an afterthought. In fact any data professional worth their salt can derive the tables once they understand what they’re impacting.
Here’s the full, five-levers model described roughly as a metrics tree (you know how much I love those). Keep in mind that this model is vague by design so it can apply it to any business.
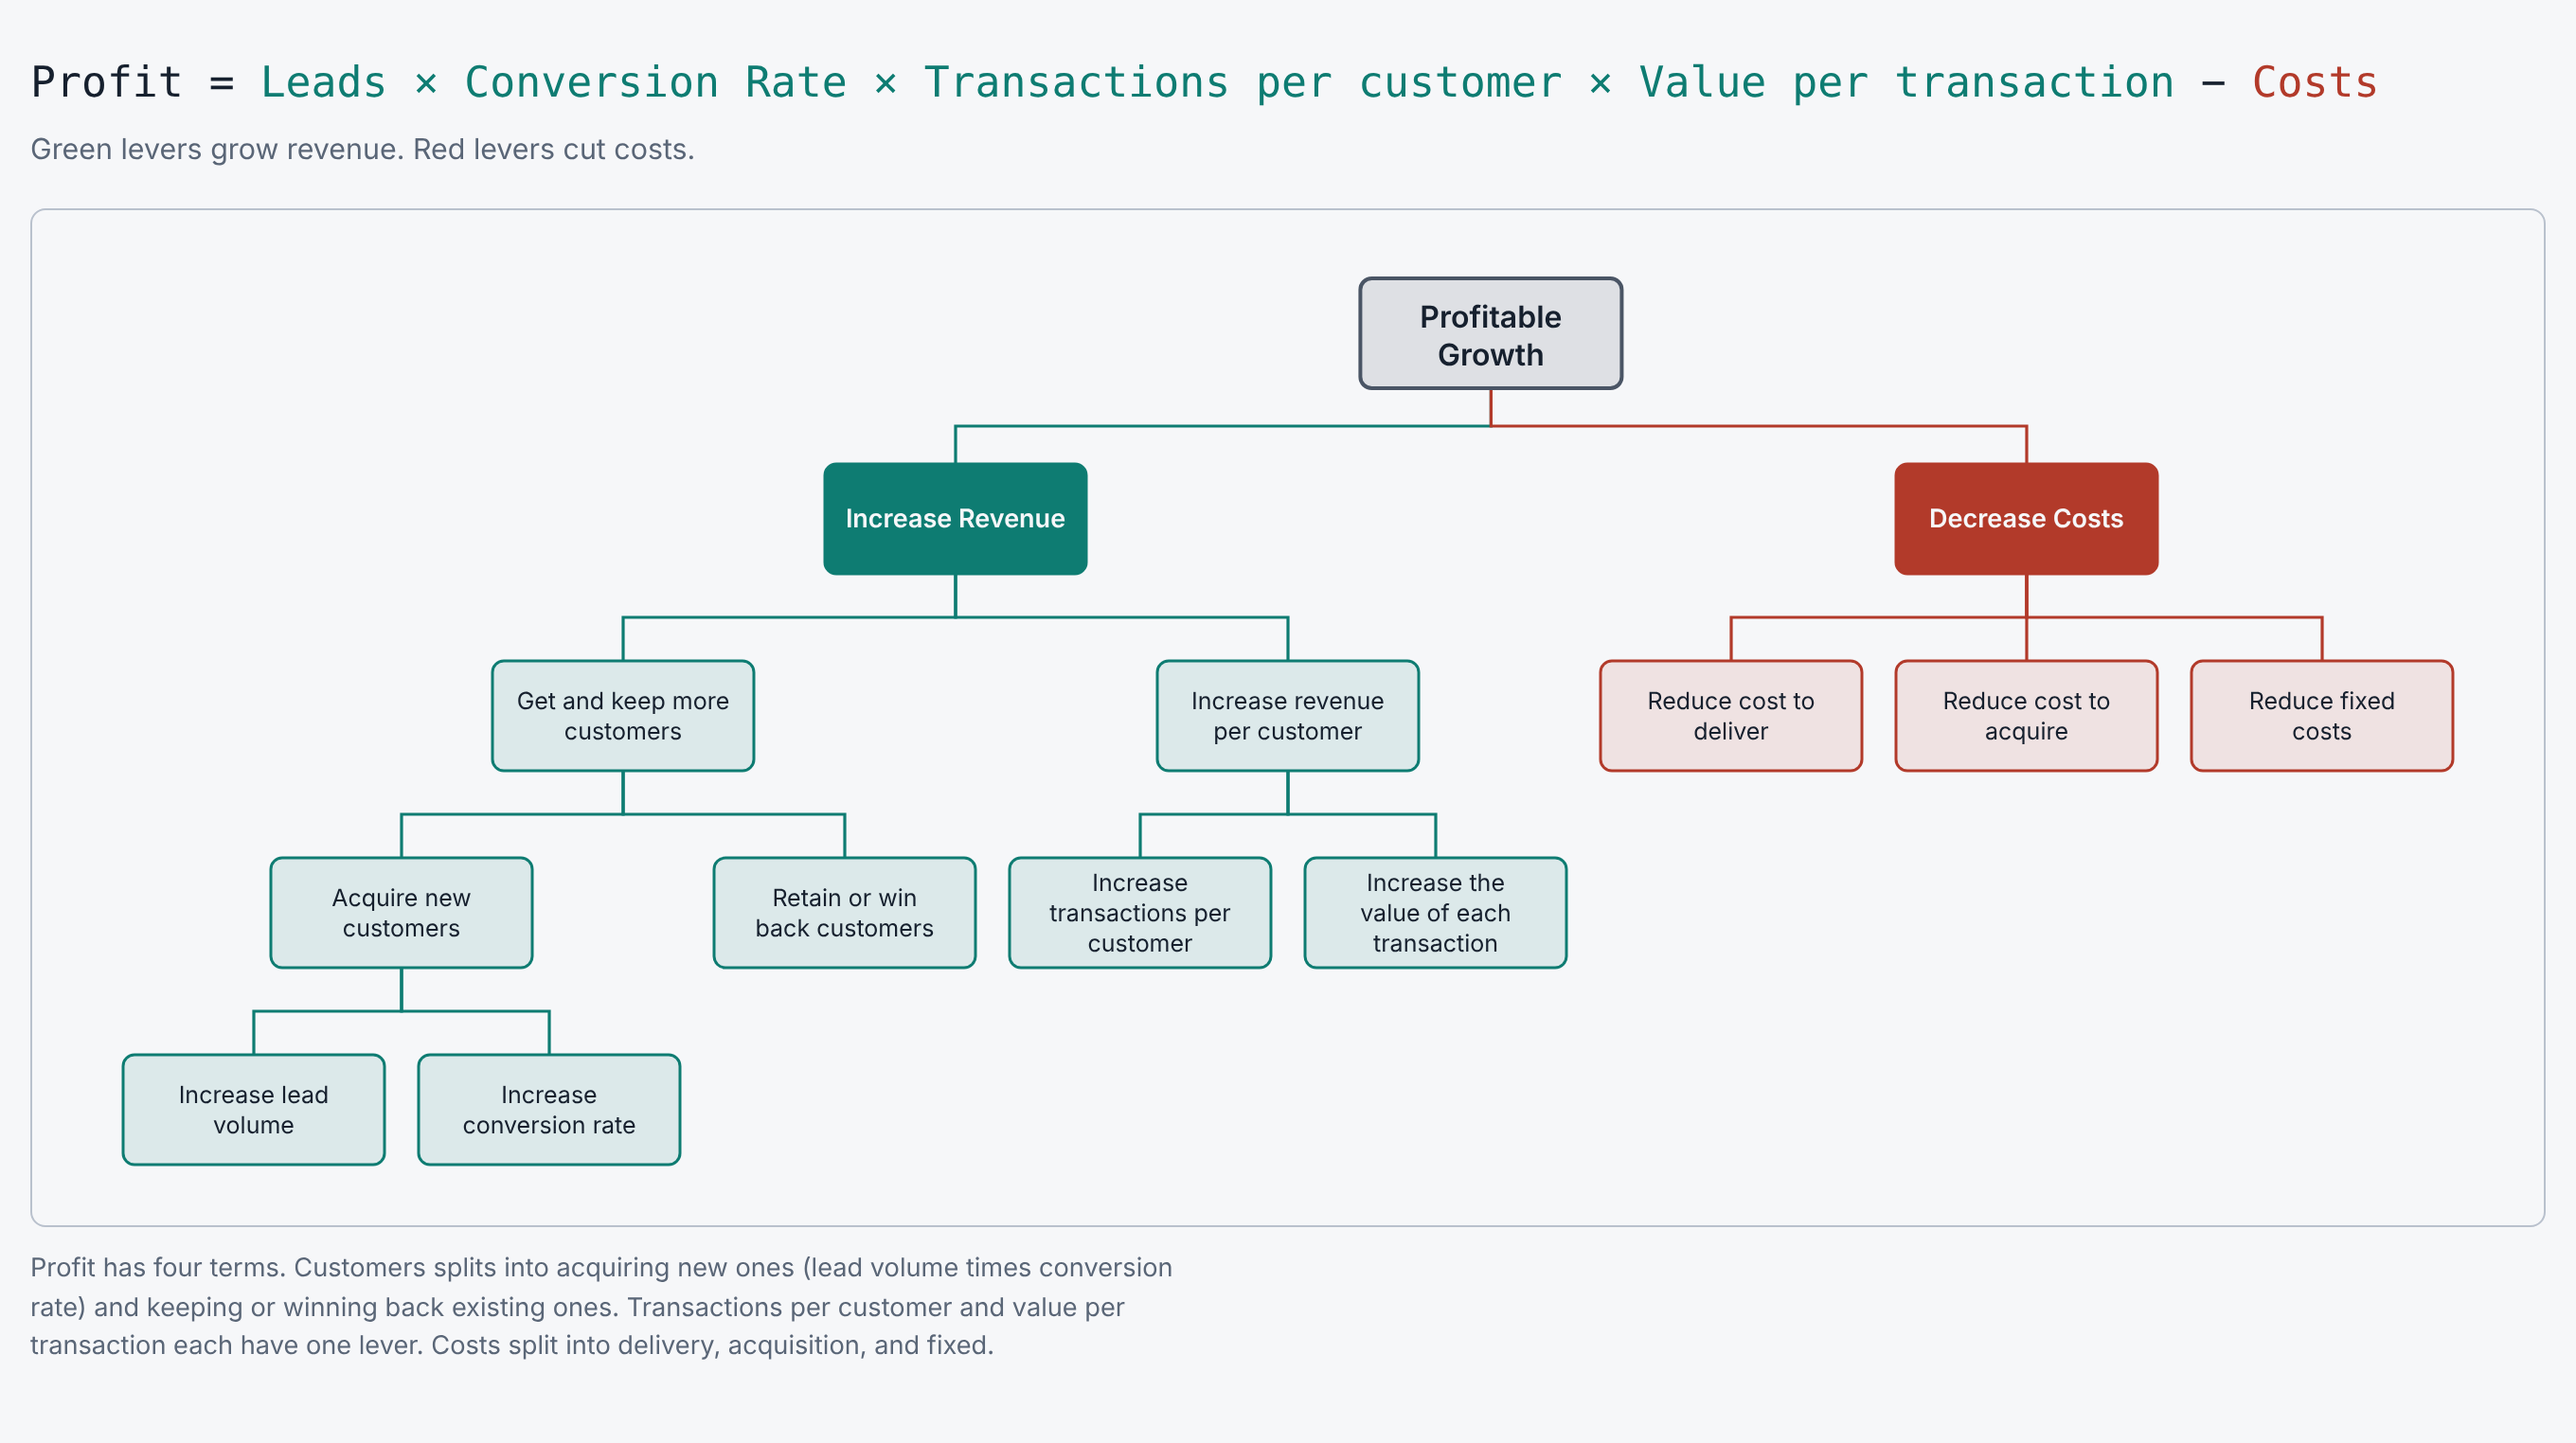
To grow a business profitably, you need to Increase Revenue and Decrease Costs. Note right away that while decreasing costs improves profitability, there’s a limit to how much you can improve. When costs equal zero you no longer have a business, while revenue can increase by a factor; (you can double, triple even 10x it!)
To Increase Revenue you can get (and keep) more Customers, Increase Revenue per Customer or both. To get more customers you can get more Leads and/or improve conversion rate Leads => Customers. To increase revenue per customer, you can increase the average Value of each Transaction and/or increase the number of Transactions per Customer.
The specifics of how you do each one are unique to every business (e.g. improve offers, create new products, improve product features, change prices, etc.) but that’s easy to figure out once you get the big picture. This model can act as a map. When the CEO states the strategic objective as “increase revenue by 30%” it can easily be understood as one of the above levers:
-
Do we want to get more customers and dive into new markets?
-
Do we want to increase revenue per customer for our existing markets?
-
Do we want to improve our retention rate?
-
etc.
Now everyone has a clear idea for how impact will be measured.
Implications of the model
There are several implications of this model as far as analytics is concerned. First and foremost this model serves as a map of Impact. You can see exactly how your day to day work impacts the bottom line. Say you work in marketing improving the performance of the paid campaigns. How does your work impact the bottom line?
You’re probably working to increase the number of leads acquired while also decreasing the acquisition cost and improving lead quality which impacts the conversion rate Lead => Customer. If you work say in product analytics, you’re most likely working to improve conversion rate while also improving retention (increasing LTV or decreasing churn.)
The next implication is a massive reduction in complexity of understanding any business model. A recurring revenue business model (e.g. subscription SaaS) works by increasing LTV (Revenue/Customer) by increasing the number of transactions per customer while a re-occurring business model focuses more on increasing AOV (the value of each transaction.)
No longer do you need 100 dashboards or 500 metrics to understand the business. So now when someone comes to you with a question or a request for a dashboard, you don’t even have to ask them why they need it, you can guess and help them too.
So say they want a dashboard of customers who purchased twice or more in the last 3 months. What are they trying to figure out? My guess is they’re looking to see if there’s a segment of customers based on the frequency of transactions that are better than others compared by LTV. Now you can turn their request into a project to look for other possible signals to segment the customer base on.
Another implication is focus.
You can now rank all analytics requests based on what impact they might have on Lead Volume, Conversion Rate, Revenue per Customer, Revenue per Transaction, or Costs. Then you can justify the ranking. Then you can think up new analytics projects that have direct impact on the bottom line.
How to apply analytics to the model
Once you internalize the growth model above, the natural next question is how does analytics actually help? There are many different techniques in analytics, aren’t there? Well if you look at it from the perspective of patterns there’s only a handful. I don’t have them all codified yet (I hope to soon) but I’ll give you a couple of powerful ones:
-
Smart Segmentation
-
Targeted Experiments
-
Targeted Action
To illustrate let’s revisit the case studies from my most popular post, Leverage Points and Where to Find Them:
How PayPal boosted revenue by $100 million
-
Levers impacted
- Revenue per customer
-
Analytics methods used
-
Behavioral segmentation
- Find customers who already had customers of their own
-
Targeted experimentation
- They tried the lead scoring model on a handful of clients before expanding
-
Targeted action
- White-glove onboarding service for high scoring leads
-
Improving retention at HubSpot
-
Levers impacted
-
Revenue per customer
- Net Dollar Retention (NDR)
-
-
Analytics methods used
-
Firmographic segmentation
- Segment customers by business size
-
Targeted action
- They focused on acquiring more “Tier 1” customers (companies with 11+ employees)
-
Subscribe to Data Wise
Patterns, ideas and stories on how data can find, create and drive leverage.
Delivered by Substack. See the newsletter